
Appearance
How to use the dashboard
When you sign in, the dashboard shows: a Smart Invoice sign-up banner if your store hasn't completed Smart Invoice activation; a Disclaimer Information banner with data-licence terms; the Shortcuts row (8 tiles: Create, Edit, Stock Take, Receive, Customers, Suppliers, Incoming, App Store); the Key Metrics row (Below Min, Stock Value, Received, Tickets, Specials); the Analytics section with a Turnover chart and a Search Stock widget; and the full sidebar drawer.
At a glance
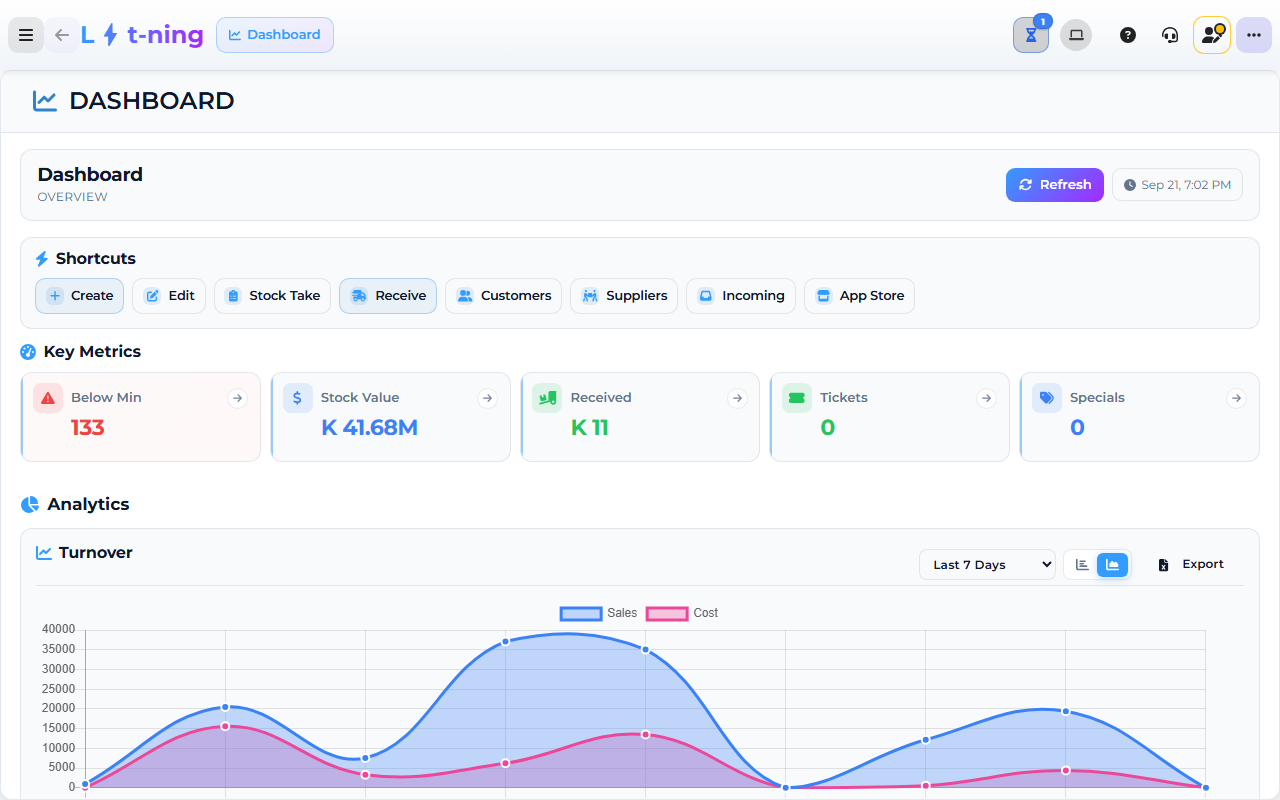
The image shows the Core App dashboard at sign-in. The sidebar groups every screen (DAILY OPERATIONS, STOCK MANAGEMENT, CUSTOMER MANAGEMENT, TILL MANAGEMENT, ADD-ONS & INTEGRATIONS, SALES MANAGEMENT, SUPPLIER MANAGEMENT, REPORTS & ANALYTICS, FINANCE & ADMIN, SYSTEM & SETTINGS, SUPPORT & DOCUMENTATION). The 8 Shortcuts row sits below the top bar. Screens may differ slightly by version.
Goal
Find the right screen quickly without clicking through menus you do not need.
Where this happens
- In the back office (Core App): the dashboard is the first screen after sign-in.
The dashboard is the screen you see right after sign-in. It shows your store's key numbers, the shortcuts you use most, and the sidebar with every menu you have access to.
Problem
You want to find the right screen quickly without clicking through menus you do not need.
Prerequisites
- Signed in to your store (see How to sign in)
Steps
1. Read the top bar
The dashboard header (Dashboard.vue + drawer header) shows:
- Hamburger menu — opens and closes the sidebar drawer.
- Dashboard heading + Overview subtitle — the current screen.
- Refresh button — reloads the metrics and chart. After a refresh, a
last-updatedindicator appears in the header with the timestamp. - The drawer header shows your name, role, the store you are signed in to, plus Device ID and Version at the bottom.
2. Use the sidebar drawer
The drawer (sidebar) groups every screen in Lyt-ning under these group headings (live app order):
| Drawer group (live app) | Contains |
|---|---|
| DAILY OPERATIONS | STOCK MANAGEMENT — Create Item, Edit Stock, Receive Stock, Stock Take; CUSTOMER SERVICE — Create Customer, Edit Customer, View Invoices; TILL MANAGEMENT — Edit Float, Store Cashups, Shortcuts |
| ADD-ONS & INTEGRATIONS | Reset Account, Lyt-Accounting, Manage Online Store, Cash.co.zm, Loyalty Setup |
| SALES MANAGEMENT | Invoice, Quote, Cashup Reports, Active Specials |
| SUPPLIER MANAGEMENT | Create Supplier, Edit Supplier |
| REPORTS & ANALYTICS | Legacy Reports, New Reports Platform + Standard / Financial / Inventory report groups |
| STOCK MANAGEMENT (full hub) | Edit Stock Item, Delete Stock, Specials, Expiring Stock, Mass Price Edit, Mass Stock Update, Stock Categories, Receive Stock / GRV, Central GRV Management, Purchase Orders, Production, Stock Adjustments, Stock Take, Recipes, Stock Transfer, Stock Conversion |
| CUSTOMER MANAGEMENT | Franchise / Main Debtors, Create Account Customer, Edit Account Customer, View Quotes, View Invoices, Proof-Of-Payment, Delivery Notes, Layby Customers |
| FINANCE & ADMIN | FINANCIAL MANAGEMENT — Cash and Accounts, Currency Setup, Expense Categories, Expense Records, Ledger Entries, VAT Reports, VAT Codes Guide; HR MANAGEMENT — Create Employee, Edit Employee, Employee Security; ASSET MANAGEMENT — Fixed Asset Categories, Fixed Asset Records |
| SYSTEM & SETTINGS | SYSTEM CONFIGURATION — System Settings, Franchise Management; TILL & PAYMENTS — Payment Methods, Kazang Settings, Smart Invoicing; BILLING — Subscription & Accounts |
| SUPPORT & DOCUMENTATION | Report an Issue, View Tickets, Service Level Agreement, User Manual |
| SIGN OUT | Download & Update, User Logout, Switch Store |
Click a group to expand or collapse it. Click an item inside to open that screen.
The REPORTS & ANALYTICS group is a sidebar breadcrumb only — each item opens the Lytning Analytics app (analytics.pos.co.zm) in a new browser tab with single-sign-on. See Lytning Analytics for the full report list.
3. Use the Shortcuts row
The dashboard shows a row of shortcut buttons for the actions staff open most:
- Create — add a new stock item.
- Edit — change an existing stock item.
- Stock Take — start a stock count.
- Receive — record a new delivery (GRV).
- Customers — customer management.
- Suppliers — supplier management.
- Incoming — view incoming stock transfers (badge shows the count).
- App Store — browse add-on applications.
Click a shortcut to open that screen.
Where to find the full list of shortcuts: TILL MANAGEMENT → Shortcuts in the drawer. The dashboard shows the most common eight; the Shortcuts drawer is the authoritative list and may include franchise-specific extras your supervisor has added.
4. Read the Key Metrics
Below the shortcuts are metric cards:
| Metric | What it means |
|---|---|
| Below Min | Number of stock items that have dropped below the minimum level |
| Stock Value | Total value of the inventory you currently hold |
| Received | Total value of recent deliveries |
| Tickets | Open support tickets for your store |
| Specials | Active promotions |
A Disclaimer card (data-licence terms) appears in the same row when the store has not yet accepted the current terms.
Click any metric card to open the detailed view for that metric.
5. View the Turnover chart
The Analytics section shows the Turnover chart for the date range you choose.
- Pick a date range from the dropdown — Last 7 Days, Last 14 Days, Last 30 Days, Last 90 Days, This Month, or Custom Range (with date inputs for from / to and Apply / Cancel buttons).
- Switch between Bar Chart and Area Chart icons in the chart-type switcher.
- Click Export to download the data as an
.xlsxfile (dashboard_turnover).
6. Search Stock
Below the chart is a Search Stock widget with a Stock Code / Description toggle and a search box. Press Enter or click the arrow button to run the search.
7. Switch stores or sign out
- Switch Store is on the USER LOGIN screen, not the dashboard top bar. To change stores without signing out, sign out and open the user sign-in screen, then tap Switch Store.
- User Logout is in the sidebar drawer under SIGN OUT at the bottom. The hamburger at the top-left opens the drawer — it is not your profile.
Expected result
- You can reach any screen you use daily in two clicks or fewer.
- Key metrics refresh when you click Refresh at the top of the dashboard.
- The drawer state (expanded or collapsed groups) is remembered next time you sign in.
Edge cases
- Metrics look wrong or out of date. Click Refresh. If they still look wrong, raise a ticket.
- A screen you used yesterday is missing from the sidebar. Your role may not have access to it. Ask your supervisor to confirm your permissions.
- "Subscription warning" appears in the top bar. Renew the subscription from SYSTEM & SETTINGS → BILLING → Subscription & Accounts, or ask your supervisor.