
Appearance
Analytics — the franchise reporting app
Goal
Find the numbers behind what the tills did — sales, stock, staff, finance, debtors — without leaving the desk.
Analytics is the Lytning reporting app. Cashiers don't open it. The franchise owner, area manager, and accountant open it to read the data the tills produce: every sale, every refund, every cashup, every debtor, every stock movement, every warning. The app also produces PDF reports and Excel exports for sharing.
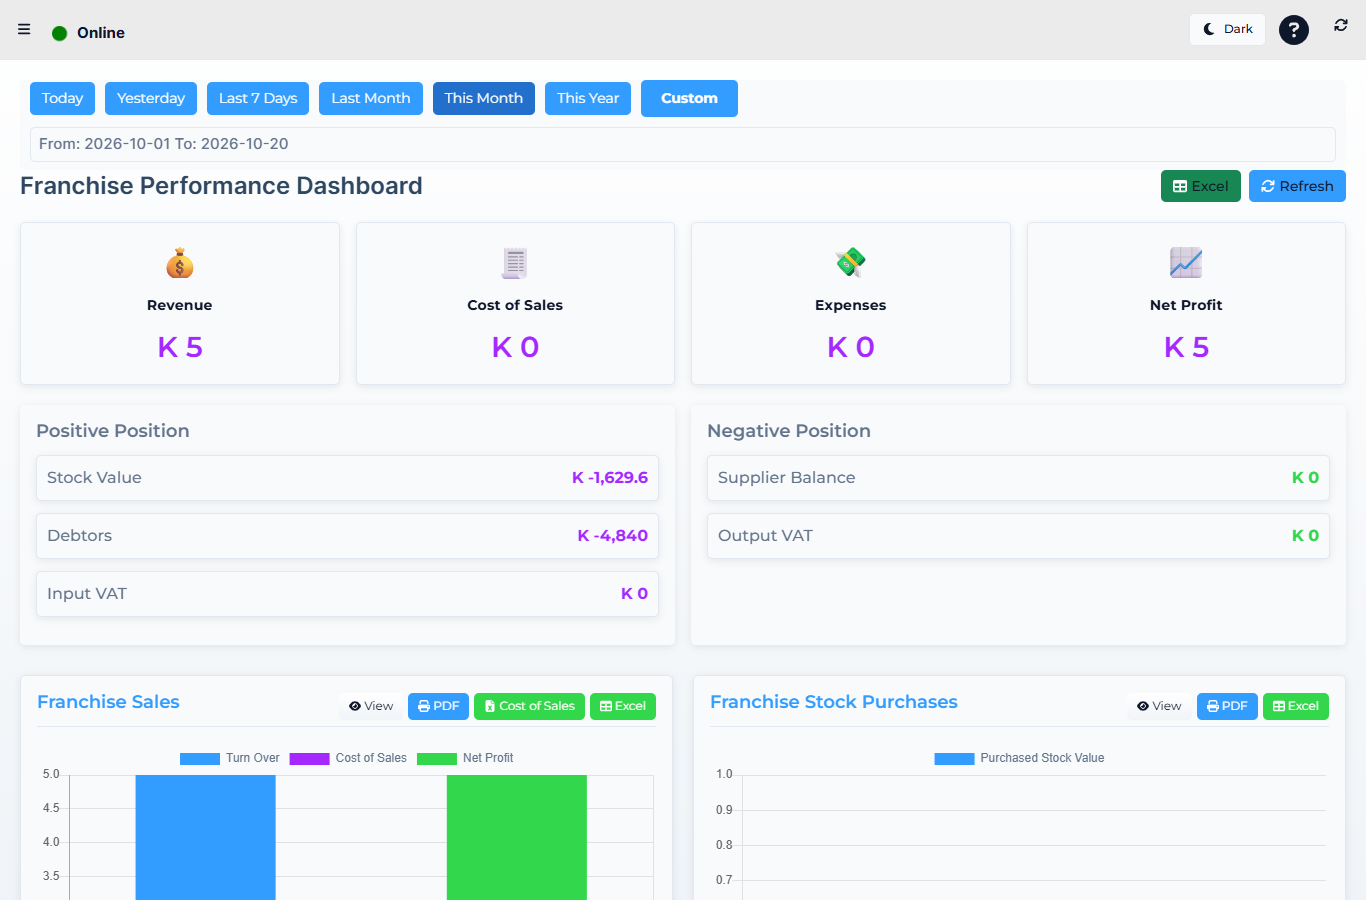 Lytning Analytics v2.2.6 at https://analytics.pos.co.zm/dashboard, captured 2026-10-19. See the evidence doc for the full route inventory. The drawer table below remains a useful reference of every menu item.
Where this happens
On the web at https://analytics.pos.co.zm/dashboard, or as a Capacitor/Electron desktop app. The app is also auto-launched from the till apps or back office by passing a signed session in the URL — opening it that way drops the signed-in user straight onto the dashboard for the right store.
The drawer — what you see on every page
The left drawer is your menu. It is the same on every screen, so the rest of the wiki pages reference it instead of re-listing it.
| # | Section | What it answers |
|---|---|---|
| 1 | Main Dashboard | "How is my franchise doing right now?" — KPI tiles + recent activity |
| 2 | Stock Reports | What is in stock, what is selling, what is missing |
| 3 | Sales Reports | Every sale, every refund, every cashier, every category |
| 3a | ↳ Table Audit Log | What happened on each table (manager path) |
| 3b | ↳ Sales Dump Export | A per-store Excel of every sale for a date range |
| 4 | CashUp Report | Every end-of-shift cashup, variances, audits |
| 5 | Finance Reports | Income, expenses, payouts, money movements, safes, ledgers |
| 6 | VAT Reports | VAT returns and reconciliation |
| 7 | Accounts Reports | Debtors, creditors, AR/AP, debtor activity |
| 8 | Supervisor Report | Voids, refunds, discounts, price changes, sold-below-cost, stock-take variances, un-cashed-up sales |
| 8a | ↳ Table Audit Log | Same audit log, surfaced under the audit IA |
| 9 | Warnings Reports | Operational warnings, with detail drill-in |
| 10 | User Manual | The in-app searchable help |
| 11 | Logout | Clear session and return to sign-in |
The top bar holds the store selector (a specific store or "All") and a theme toggle. Switching between a specific store and All changes what every report shows — the per-store detail view vs an aggregate across your franchise.
Concepts
- Store selector — pick one store, or All to see the whole franchise. Some pages (notably Finance Reports) swap between an aggregate dashboard and a per-store detail view depending on what you pick.
- Date range — every report starts with one. The date range is usually the most important filter; everything else refines it.
- Drill-in — most reports let you click a row or a number to see the underlying lines, then the lines to the underlying invoice or transfer.
- Exports — most report screens can export to PDF (built from the in-app
pdf.jsstore) or to Excel/CSV. The Sales Dump Export is a per-store Excel pull for a date range.
Expected result
You can name a question — "How much did Smart Store sell last Tuesday?" or "Who is my worst-performing cashier this month?" — and find the answer on one of the report pages without exporting data and crunching it yourself.
Edge cases
- The store selector is empty or says "All". The store list is loaded from your franchise — if it is blank, sign out and back in. "All" is a valid choice for franchise-wide aggregates.
- A report says "No data". Check the date range and the store first. A new store or a wrong date will both look like empty data.
- You reached the app from a link and the store is wrong. Use the store selector to switch, or sign out and use the right auto-login link.
- The screen asks for a licence. The app is device-bound (FingerprintJS). If a new device was added without a licence, contact your franchise owner.
- A report number looks too high or too low. Compare the date range with the till app's Working offline guidance — if a till was offline, its sales land in Analytics only after the next sync, and can look out of period if the date filter is exact.