
Appearance
Stock reports (Analytics)
Goal
Know what you have, what is selling, and what to reorder — across every store.
The Stock Reports section in the drawer is the single entry point. It opens the Stock Dashboard and gives you access to every stock-flavoured report.
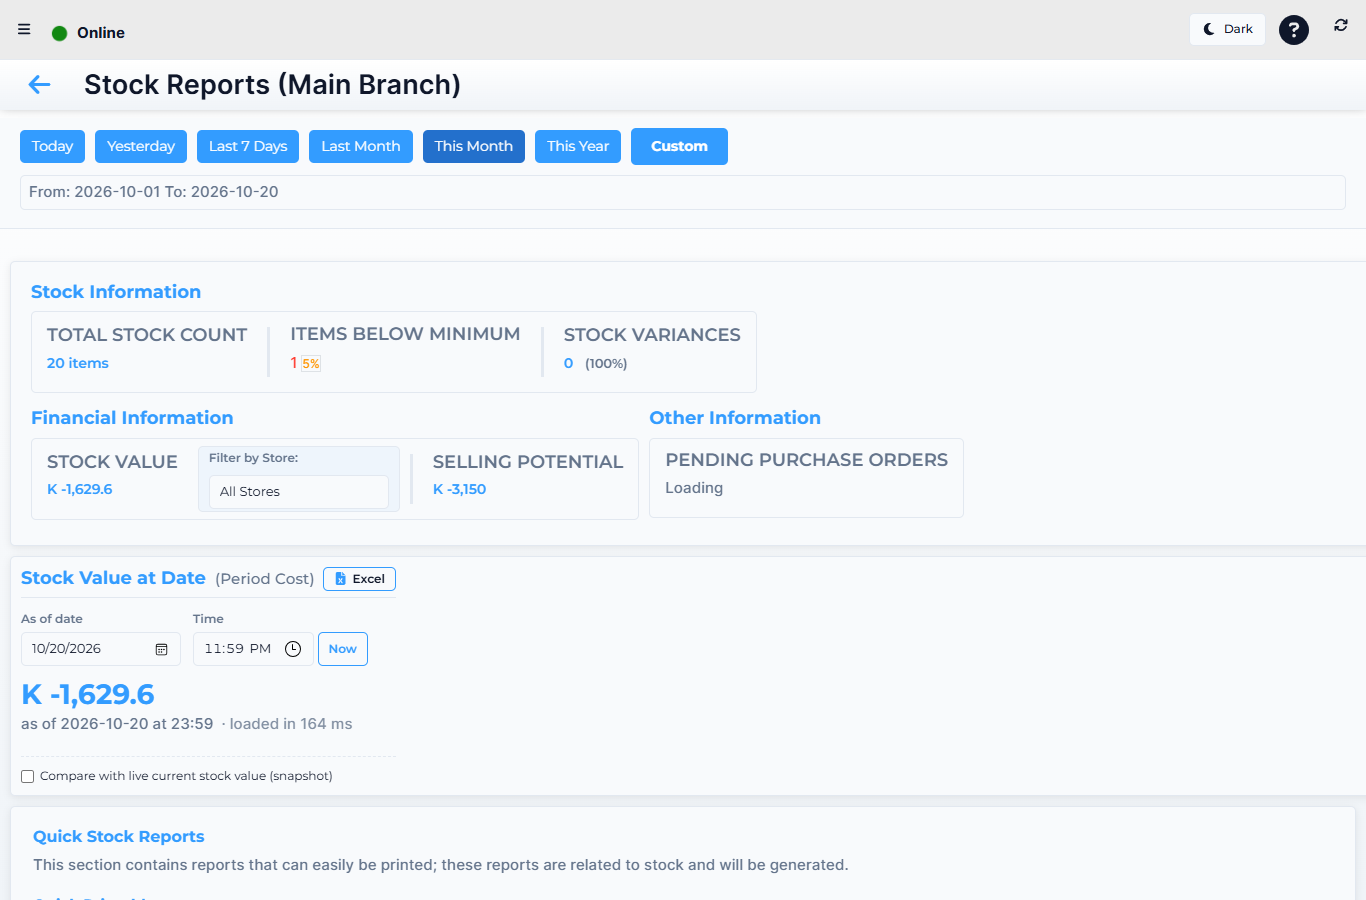 Lytning Analytics v2.2.6 at https://analytics.pos.co.zm/dashboard, captured 2026-10-19. See the evidence doc for the full route inventory.
Where this happens
Open the menu and click Stock Reports. You land on the Stock Dashboard — stock value, low-stock alerts, top movers at a glance.
The reports behind Stock Reports
| Route | What it shows |
|---|---|
| Stock Dashboard | Stock value, items below their reorder point, top sellers, dead stock — pick store and date range at the top |
| Stock Reports | The canonical stock reports screen: a wide table of items with filters (category, supplier, current vs sold) |
| Items Sold Below Cost | Every line that was sold for less than its cost — a margin-alert report for the franchise owner |
| Reorder Stock | Items at or below their reorder point, with the suggested reorder quantity — the action list for buyers |
| GRV Reports | Goods Received Vouchers: what each store received from suppliers, when, and at what cost |
| Stock Transfer Received | Inter-store stock transfers received by the selected store in the period |
| Stock Transfer Sent | Inter-store stock transfers sent by the selected store in the period — pair with Received to spot imbalances |
| Stock Take Report | The history of every stock take (counting sheet) and the variance vs the recorded stock — variance highlighted |
| Stock Adjustment Report | Every manual stock adjustment (write-off, correction, damage, received-out-of-band) with who, when, why |
| Stock Item Report (per-item) | Drill into a single item: current stock by store, movement history, cost, selling price, margin |
| Stock Item History | Every movement for a single item — sales, transfers, adjustments, GRVs, stock-take changes — on one timeline |
| Item Links | Linked items (substitutes, kits, combos) — what the system treats as related to this item |
How to read a stock report
- Pick the store (or "All") at the top. For franchise-wide stock health, use "All".
- Pick the date range for movement-based reports (transfers, adjustments, sales). For a current-snapshot report (current stock value, low-stock alerts), the date is the "as-of" point.
- Apply category / supplier / store filters as needed.
- Read the summary numbers at the top, then the lines below.
- Click a line to drill into the item detail (Stock Item Report) or the item history.
- Export to PDF or Excel from the toolbar when you need to share.
Expected result
You can answer "what is low", "what is overstocked", "what sold below cost", and "what moved between stores" without exporting to a spreadsheet.
Edge cases
- An item shows zero stock but the till still sells it. The till is selling from its own cache and has not synced yet. The number will catch up after the next sync. See Working offline.
- Stock Take variance is large. That is the point of the report — the variance IS the loss. Investigate the count (spillage, theft, miscount) before re-counting.
- Reorder Stock suggests huge quantities. The reorder quantity is calculated from average sales; for seasonal items, override manually at the back office.
- A transfer shows in Sent but not Received. Either the receiving store has not accepted it yet, or there is a sync delay. Check the receiving store's till or back office.