
Appearance
Exports and PDFs (Analytics)
Goal
Get the numbers out of Analytics — as a PDF for a meeting, an Excel for analysis, or a scheduled share for the accountant.
Every Analytics report can be exported. The Sales Dump Export is the one-off Excel pull most teams use; the rest use the per-report Export toolbar.
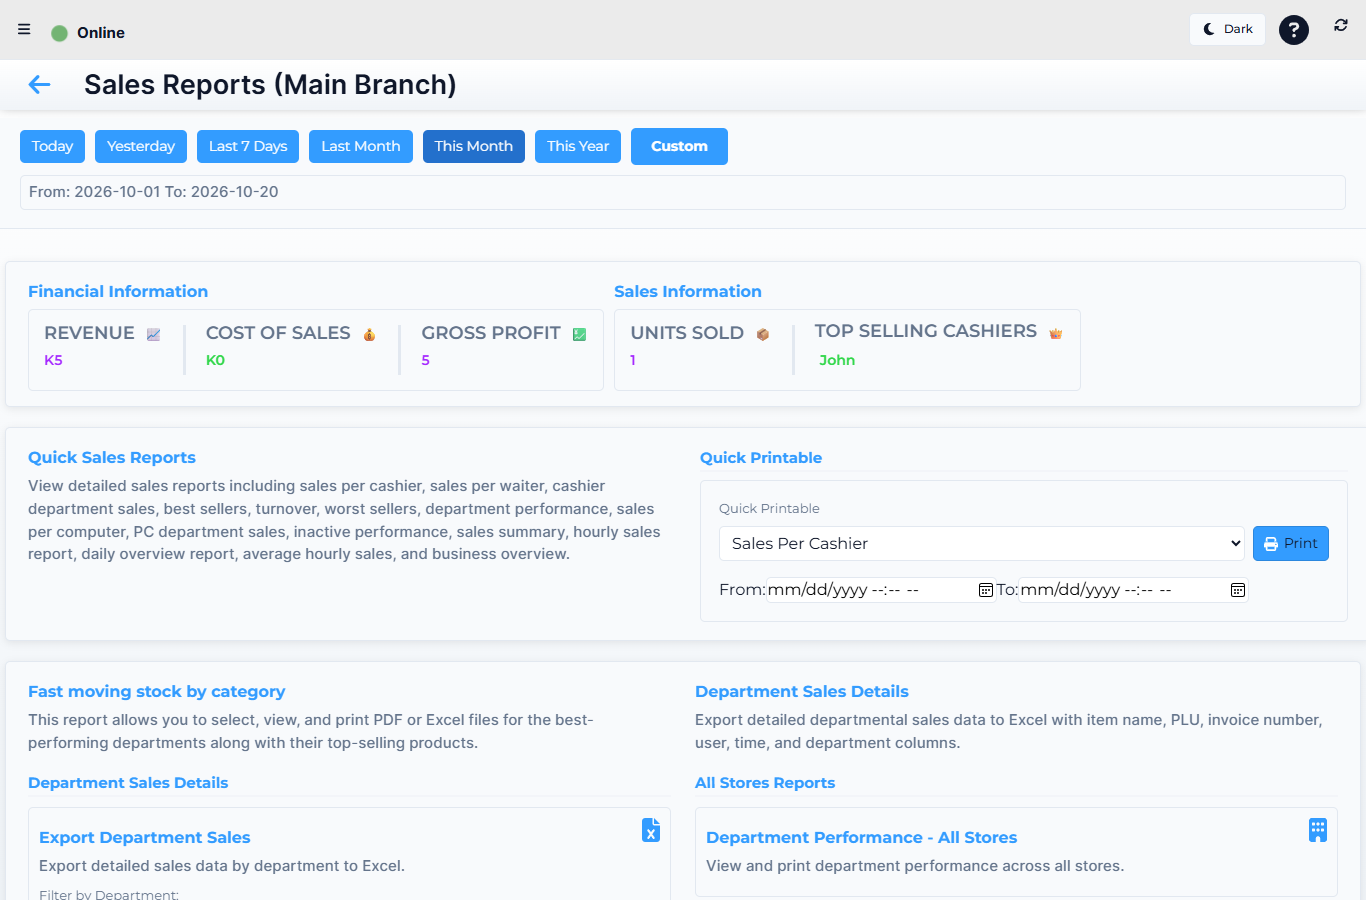 Lytning Analytics v2.2.6 at https://analytics.pos.co.zm/dashboard, captured 2026-10-19. See the evidence doc for the full route inventory.
Where this happens
- Per-report PDF / Excel — the Export toolbar on every report screen (top right of the report).
- Sales Dump Export — drawer → Sales Reports → sub-item Sales Dump Export.
The exports
| Export | When to use it | Output |
|---|---|---|
| Export to PDF (per report) | A report for a meeting, an audit pack, or an attachment to a support ticket | PDF, matching what you see on screen |
| Export to Excel / CSV (per report) | Ad-hoc analysis in a spreadsheet, sharing with someone without an Analytics sign-in | XLSX or CSV, matching what you see on screen |
| Sales Dump Export | A per-store Excel of every sale in a date range — for the accountant, for an external review, or for an audit | Excel file (.xlsx), one row per line, with all fields |
Sales Dump Export — step by step
- Open the menu and click Sales Reports → Sales Dump Export (the sub-item at the bottom of the section).
- Pick the store (it must be a single store — not "All").
- Pick the From and To dates.
- Click Generate Sales Dump.
- The app opens the Excel download in a new tab — save it, then open it in your spreadsheet.
The Excel contains one row per sale line, with the sale number, date, cashier, store, line description, quantity, unit price, line total, VAT, tender, and any line-level discount or void flag. It is the same shape every time, so it is safe to consume in a recurring spreadsheet or BI tool.
How to use the per-report Export
- Open any report (for example Sales reports → Multi-Store Department Performance).
- Set the filters and the date range you want.
- Click Export in the top right.
- Choose PDF or Excel/CSV — the export honours the filters and the current view.
The PDF is the screen you are looking at, formatted for print. The Excel is the same rows, ready for analysis.
Expected result
A file you can hand to anyone — an accountant, a banker, a regional manager — without giving them a sign-in.
Edge cases
- The Export toolbar is missing on a report. That report is view-only (for example, the Main Dashboard). Use the per-section reports to export.
- The Sales Dump Export refuses to generate. The store selector is "All" — pick a single store. The export is per-store by design.
- The Excel file is huge. The dump is one row per sale line, so a year of busy sales can be tens of thousands of rows. Filter the date range down, or open it in a spreadsheet that handles large files.
- A scheduled export used to run and stopped. Analytics does not have a built-in scheduler; scheduled reports are a back-office feature. Ask your franchise owner.
Related
- Analytics — the franchise reporting app
- Sales reports (where the Sales Dump Export lives)
- Finance reports (typical PDF recipients)