
Appearance
Staff and shift performance (Analytics)
Goal
See how your waiters, cashiers, and shifts are performing — and where to coach.
This page groups the people-side reports. They are reached from the Sales Dashboard (waiter metrics) and the Supervisor Dashboard (user stats). The shift-end reports live on their own page — see CashUp report.
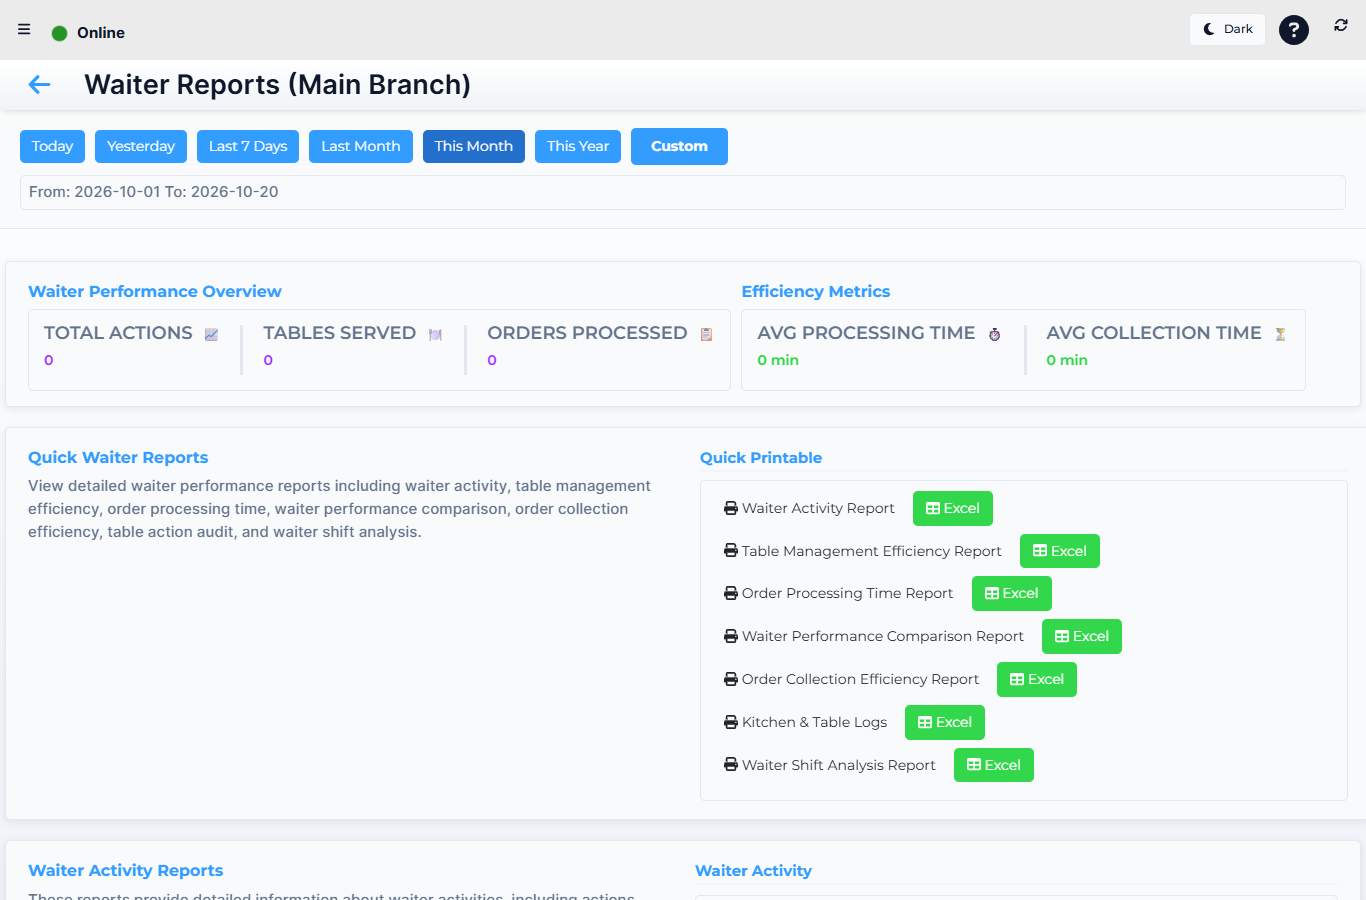 Lytning Analytics v2.2.6 at https://analytics.pos.co.zm/dashboard, captured 2026-10-19. See the evidence doc for the full route inventory.
Where this happens
From the Sales Dashboard (drawer → Sales Reports), open the waiter-flavoured reports. From the Supervisor Dashboard (drawer → Supervisor Report), open the user-stats report.
The reports
| Route | What it shows |
|---|---|
| Waiter Reports | Per-waiter totals — sales, items served, average ticket — over the chosen period |
| Waiter Activity | The same data over time — who is working when, and how busy each shift is |
| Table Efficiency | How quickly tables turn, and how long items wait between course and serve — the restaurant throughput view |
| Order Processing | The time from order taken to order fulfilled (kitchen) — the speed-of-service view |
| Performance Comparison | Compare two or more waiters side by side on the same KPIs |
| Collection Efficiency | How long it takes to collect payment after the order is ready — the cash-flow-at-the-table view |
| Shift Analysis | Sales and items per shift, broken down by the shift definitions your franchise uses |
| Table Audit Log (shared with Sales and Supervisor) | Every action on every table — open, add line, save, pay, transfer, merge, split, void — with who and when. See Supervisor report for the audit IA |
| Supervisor User Stats | Per-user activity on the tills — sign-in time, items sold, voids, refunds, discount usage, overrides. The HR-flagship report |
How to read these reports
- Pick the store (or "All") and the date range.
- Apply the report's own filters (waiter, shift, etc.).
- Read the summary at the top, then the per-person lines.
- Click a person to drill into their day-by-day activity.
- Export to PDF or Excel to share with the manager or the staff member.
Expected result
You can name a question — "who is my fastest waiter in Lusaka this month" or "who used the most discounts in Chilenje last week" — and answer it from one of these reports, with the option to drill to the underlying transactions.
Edge cases
- A waiter shows zero activity. Either they did not work in the period, or the till did not record a waiter for their sales. Ask the franchise owner to check the staff-roster and the till's settings.
- Table Efficiency is low across the board. The bottleneck is likely in the kitchen (order-processing time) — open that report and compare.
- User Stats shows a high void/refund rate for one person. Use the Supervisor report voids and refunds screens to confirm; coach or escalate.
- A name is missing from the list. The user may not be linked to the chosen store — try "All" or check the franchise owner.
Related
- Sales reports
- Supervisor report
- CashUp report
- Working offline (offline data can lag behind)